|
St. Francis |
|

|
Home Page Workshop Home Computers Home |
||
|
Computer Navigation & Satellite Charts |
||
|
Photos & Scanning |
||
|
iPad Navigation |
||
|
eBooks |
||
|
Movies |
||
|
Sharing Your Adventures |
||
|
Internet Access in Remote Locations |
||
|
Making Money from Your Website |
||
|
Backups & Security |
||
|
Useful Utilities |
||
|
Computer Links |
||
|
About Us |
||
|
Contact Us |
||
|
|
Computer Tips and Tricks
Computer Navigation
Last Updated:
05/18/2025
| Making Charts from Satellite Imagery | Converting Maxsea
Tracks and Waypoints to GPX for OpenCPN |
|
| How We Navigate | ||
| Downloading the Charts we have already made | ||
| Our Navigation How-to Presentations | ||
When we left the U.S. in 2007, the computer navigation systems were running in the $2,000-$5,000 range. We just couldn't afford that, and especially not two of them (every long range cruisers needs critical equipment backups). We also could not afford to keep buying map cartridges every time we moved a couple hundred miles--this is both a cost issue and an access issue.
So our primary navigation system when crossing the Pacific consisted of the following:
1. A Garmin
GPSMap 76Cx on the helm (with maps installed).
Link to current equivalent
on Amazon
2. A laptop down below on the nav station, with a NMEA connection to
the Garmin, but also a USB backup GPS if we need it
3. A 15" 12-v (cheapo) LCD monitor on a swing out arm in the
companionway.
4. A 'presentation
mouse' to manipulate the computer from the helm station. Note, there are
other much cheaper-appearing options on Amazon, however, most do NOT include
an actual "mouse" function. Most only have forward and back buttons,
good for slide shows, but not for mouse movement on screen. This
device also has a 60 ft range. Here's an alternative from Keyspan with
a
100 ft range.
Our original navigation laptop in 2007 was an old (purchased second-hand) Dell laptop. It was a several thousand dollar laptop when new, but we bought it 'refurbished' for about $200. It doesn't need to be super-fast, and it didn't need much more than a 40-GB hard drive. It was running Windows XP.
The first thing we did was strip almost ALL of the software off the computer. We disabled the wifi, and took off the anti-virus and firewall, and made sure that NOTHING was being started by Windows at computer startup. We also removed the 'user sign-in'. So, turn this computer on, and it boots up immediately.
Then we carefully put ONLY navigation and 'underway' applications back on it:
-
The OpenCPN navigation program
-
GPSGate to help manage the GPS and Serial Ports for several navigation programs (optional)
-
Airmail (properly configured for our underway communications functions (not needed with Starlink)
-
WXTide32 - Worldwide Tide Program (free)
-
GPSU - For transforming GPS waypoints and downloading to Garmin (optional)
-
A simple photo program of your choice (see ours)
This computer NEVER never connected to the internet... so it didn't need the anti-virus applications, Windows Updates, etc.
2024 Update: with the advent of Starlink (and a number of other technological advances), our Nav computer is now connected to the internet either by cell or by Starlink most of the time. We are just careful about where we browse on all of our computers, and have Windows Defender running on them all. And of course Windows Updates.
Making Charts from Satellite Imagery Using Sat2Chart
See this info as a Powerpoint Slide Show (pdf)
2020 Update: any place I refer to "GoogleEarth", understand that Google changed the interface that GE2KAP was using to make charts, so it would no longer work. The revised program, now called Sat2Chart, now best works with SAS.Planet.
Though the below information will tell you how simple it is to make a single chart, a more comprehensive explanation of the newer "mbtile" chart-making process, and all the things you can do with Sat2Chart, SAS.Planet, and mbtiles, can be found here:
http://svocelot.com/Cruise_Info/Equipment/mbTiles.htm
For support, these are the places you can ask questions.
GE2KAP/Sat2Chart Facebook Group
Sat2Chart Cruiser's Forum Discussion
Note: In 2019, Paul renamed his GE2KAP program Sat2Chart. Why?
1. Google changed the interface to GoogleEarth so it is no longer possible for GE2KAP to capture the picture, georeference it, and save it as a chart file. You can download an old version of GoogleEarth that DOES work, but using SAS.Planet is MUCH better.
2. SAS.Planet is MUCH better for many reasons. The biggest are:
YOU manage your cache, not GoogleEarth (no disappearing data), SAS.Planet
knows how to access at least 4 different satellite databases--if there is a
cloud over your spot, you can easily switch views and check to see if
another satellite database has a good view.
Important: If you like GE2KAP/Sat2Chart and use it, you should
go and buy Paul Higgins a
beer.
He has spent a lot of time on this tool, and it is VERY useful to us
yachties in remote places. Just think of how much money you have previously
spent on charts and chart chips, and Paypal him $20.
The primary program I use here is Sat2Chart. Sat2Chart will interface with
SAS.Planet, and take what is currently shown on your
screen, and save it as a geo-referenced mbtile.
OpenCPN 5.0 and above can use the newer graphic format of mbtiles.
mbtiles provide much superior detail/color rendition than KAP files.
The benefit of making chart files vs navigating IN Google Earth/SAS.Planet, is twofold...
1. You can use the built-for-navigating programs you are already familiar
with, and make routes and waypoints, etc without learning yet another new
tool.
2. Once you make a chart from Google Earth, it is there, no matter what
happens to your Google Earth/SAS.Planet installation, or your satellite
image cache file.
To use Sat2Chart, you need to do the following:
1. Have a compatible version of SAS.Planet installed You
can download a
version
of SAS.Planet customized to work well with Sat2Chart from our
Sat2Chart download page... just
unzip to C:\ drive and create a shortcut on your desktop...only runs on Windows).
2. Either have your installation of SAS.Planet connected to the internet, or
have the area you wish to make a map from already saved on your computer.
3. Have the program
ooRex
installed on your computer. Paul Higgins says to install the 32-bit
version even if you are on a 64-bit Windows computer. Note that RexHide.exe
has sometimes caused a false positive virus notice on Windows Defender.
4. Have a subdirectory created to put the resulting charts (ie C:\Charts\SatCharts
or something.
Once you have done all this, follow these directions:
1. Start up your SAS.Planet program and find the location you want to make a
chart of. Whatever is shown on your SAS screen will go into the chart. You
DO NOT have to be hooked to the internet, if you have already downloaded
that view from the internet.
2. Start up Sat2Chart as any normal program, from the shortcut on the
desktop. If you have installed ooREX properly, it should just run. What you
should see are 2 screens, one a black DOS-type screen which comes and goes,
and one the user interface screen.
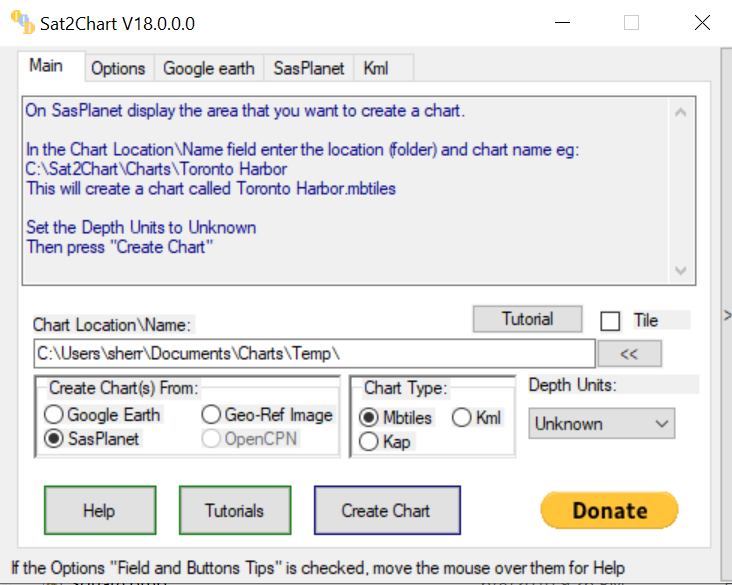
3.
To make your first chart you need to do 2 things:
a. Enter or browse to the chart directory where the new chart will be
placed, and include the filename. This goes in the Chart/Location name
field.
Ignore the stuff in the lower half of the screen for now.
ie: C:\Charts\SatCharts\Tonga\NeiafuHarbor
I think the folder you point to must already exist. Note that
Sat2Chart now has some excellent tutorials on getting started. See the
Help in the program. It is well worth a few minutes to check the
beginning help videos out.
b. Click the Create Chart Button. Voila, Sat2Chart shows some progess in the
top window.
It is finished when it displays:
Successfully Created:
C:\Charts\GECharts\Tonga\NeiafuHarbor.kap
To View the output created press "View Chart"
To Calibrate another.. display the area on Google Earth.
Enter the name of the chart to create with its filespec below.
Then press the Create Chart button.
4. You can press the View Chart button, and it uses a simple graphic file viewer to display what just got created. I recommend that, instead, you load it into your favorite charting program and see how it looks.
Be cautious when first trying to navigate with a new chart.
TRUST YOUR EYES NOT YOUR COMPUTER!!
More Details:
1. Check out the HELP button. It loads some nicely done HTML help which Paul
has thoughtfully included in the zip file. (The button will try to load the
help from a directory named Help in the same directory as GE2KAP.rex)
Paul has also done a great set of video tutorials, also accessible from the
program (must have an internet connection for these).
2. The bigger screen (higher resolution) screen you have to display
Sas.Planet on, the more area one chart will cover at a given zoom level, AND
the bigger the resulting chart file. For anchorages you need to be at
least as z17 or z18
3. Stitching charts together.
Sat2Chart has a capability to make a chart from a larger area at a higher
zoom.
- Make a route in OpenCPN of the area you want to chart. You can either make a closed circle or rectangle, or a line. If it's a line Sat2Chart will make a chart X miles (you specify X) either side of the route. If it is closed, it will make a chart for everything inside the circle/rectangle.
- Export the Route somewhere as gpx file
- Start up Sat2Chart, set your output folder (left side of screen) and browse to your route with the selection box on the upper right side of screen. Give the chart a name. Click OK.
- Sat2Chart will open SAS.Planet (and use the sat view you previously selected), have SAS.Planet download all the sat tiles, and at the end, download a completed mbtiles chart.
- Keep your hands off your computer while it is working. Sat2Chart is touchy and will quit if you do the wrong thing (ie trying to use your computer doing something else while making a chart).
It is also possible to have it
make charts of the same area using multiple map types. See
Ocelot's page for details.
4. Naming conventions - it is helpful before you start out making charts of an area to come up with naming conventions. I ended up with over 100 charts of Fiji and ended up with a hodge-podge of naming. Now when I create a new chart, I create a folder for each country and create it with the name:
<area>-<subarear>-<detail>.mbtile
Example: VitiLevu-West-VudaPointMarina.mbtile
This makes it easy to use Windows' 'sort on filename' to group the related groups of chart files. You can also put spaces in the filename--OpenCPN does not care, just keep the filename from getting too long.
You can also make subfolders by major area in a country folder, and OpenCPN will find all the subfolders too.
Naming your chartlets Fiji1, Fiji2, etc is easy, but will make you (and/or people you share it with) very unhappy in the long run.
Downloading the Charts we have Already Made
At the bottom of this list of charts are links to other sets of chart sources.
----------IMPORTANT---------
Sat2Chart is free, but please feel free to donate to Paul, if you want to
thank him for the thousands of hours of work he put into developing this
powerful tool.
Thank Paul Higgins
---------------------------------
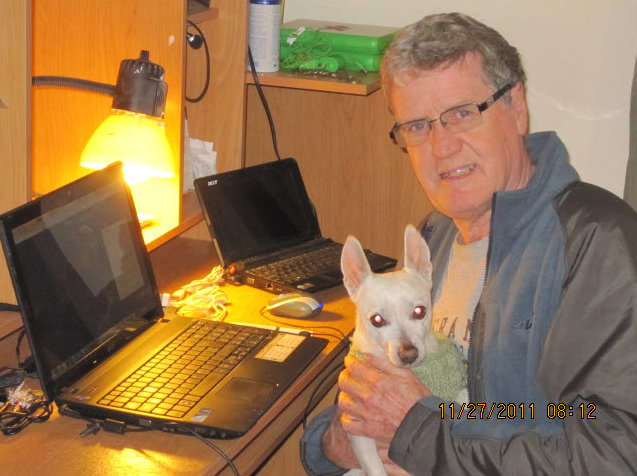
Paul and his dog, Whitey
Loading mbtile Charts into OpenCPN
1. In the OpenCPN program, click the Wrench Icon, and
click the Charts Tab
2. In the upper part of the window, browse to where you have the Charts, and
select one of the folders. You should see the full folder path in the box
just below, something like this:
C:\Charts\Satellite Charts\Fiji\
3. Click on the Add Selection button, and the folder will be added to the
'Active Chart Directories' box below. Do this for whatever charts you will
plan to use in the near future. Note that if you have chart sets
stored in subdirectories, OpenCPN will traverse the
directory tree and load up all the charts in the tree.
4. Click OK, and Open CPN will rebuild its list with your new charts
included.
5. If you have 'chart quilting' turned on in OpenCPN, Play with the pink
bars at the bottom of the screen to see which level of chart you can
choose.
6. If you have C-MAP CM93 charts loaded in OpenCPN also, you switch back and forth between CM93 view and Raster chart view by clicking between the blue-colored buttons and yellow/brown colored buttons at the bottom of the screen.
See our full "Getting the Most out of OpenCPN" presentation on our Presentations Page
Converting from Maxsea PTF files to GPX Files for OpenCPN
Quick Notes:
Do the conversion in GPSU
Do NOT save the PTF file!!
Open the resulting GPX file in Wordpad or other text editor
Marks/Waypoints
---------------
Search and replace the following:
<sym>265</sym> to <sym>anchorage</sym> (anchor)
<sym>120</sym> to <sym>diamond</sym> (blue diamond)
or <sym>xmred</sym> (red x)
or <sym>triangle</sym> (black triangle)
or <sym>scuba</sym> (Scuba Flag)
If left untouched, the 120 will translate to a black circle.
Useful Links: